As the field of econometrics and finance requires analysis on large sets of data in order to identify the various financial indices. It is necessary to understand the various forms of raw data which are present so as to formulate the best way to do calculations to avoid and major mistakes.
In this article, we will cover the various types of data used in the field of econometrics including Cross sectional data, time series data, and pooled data. We will also explain the important features of each one of them and the fields where they are best utilised followed a comparison, summarising the key differences in them.
Econometrics
As the name suggests, econometrics involves the use of mathematical metrics on economic values and data. It is a branch of economics that includes application of statistical analysis methods and techniques for calculating the various economic values.
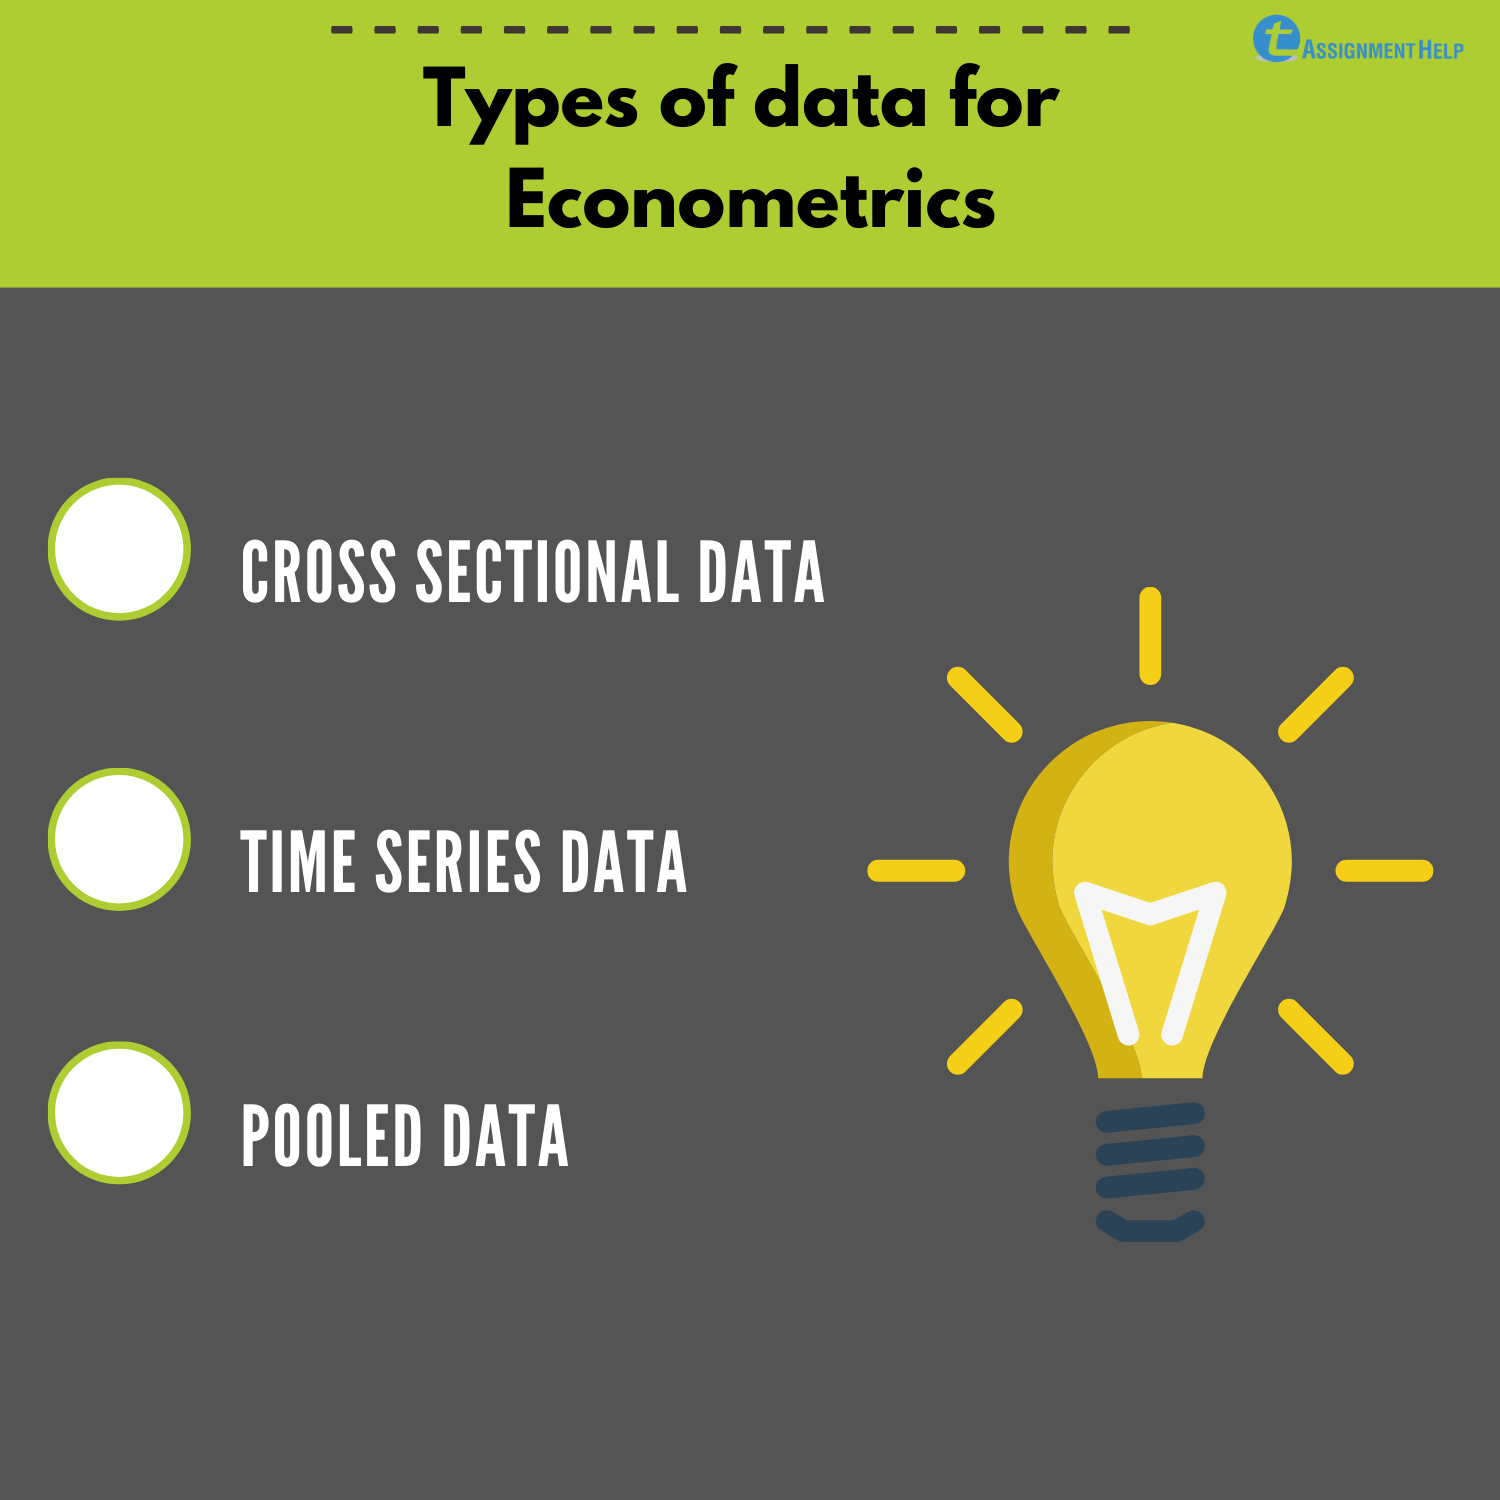
There are three types of data on which the econometric analysis are done:
- Cross Sectional Data
- Time Series Data
- Pooled Data
Cross Sectional Data
Cross Sectional Data is a component of Cross Sectional Analysis or cross sectional study. The data collected for the purpose of performing the analysis is called Cross Sectional data.
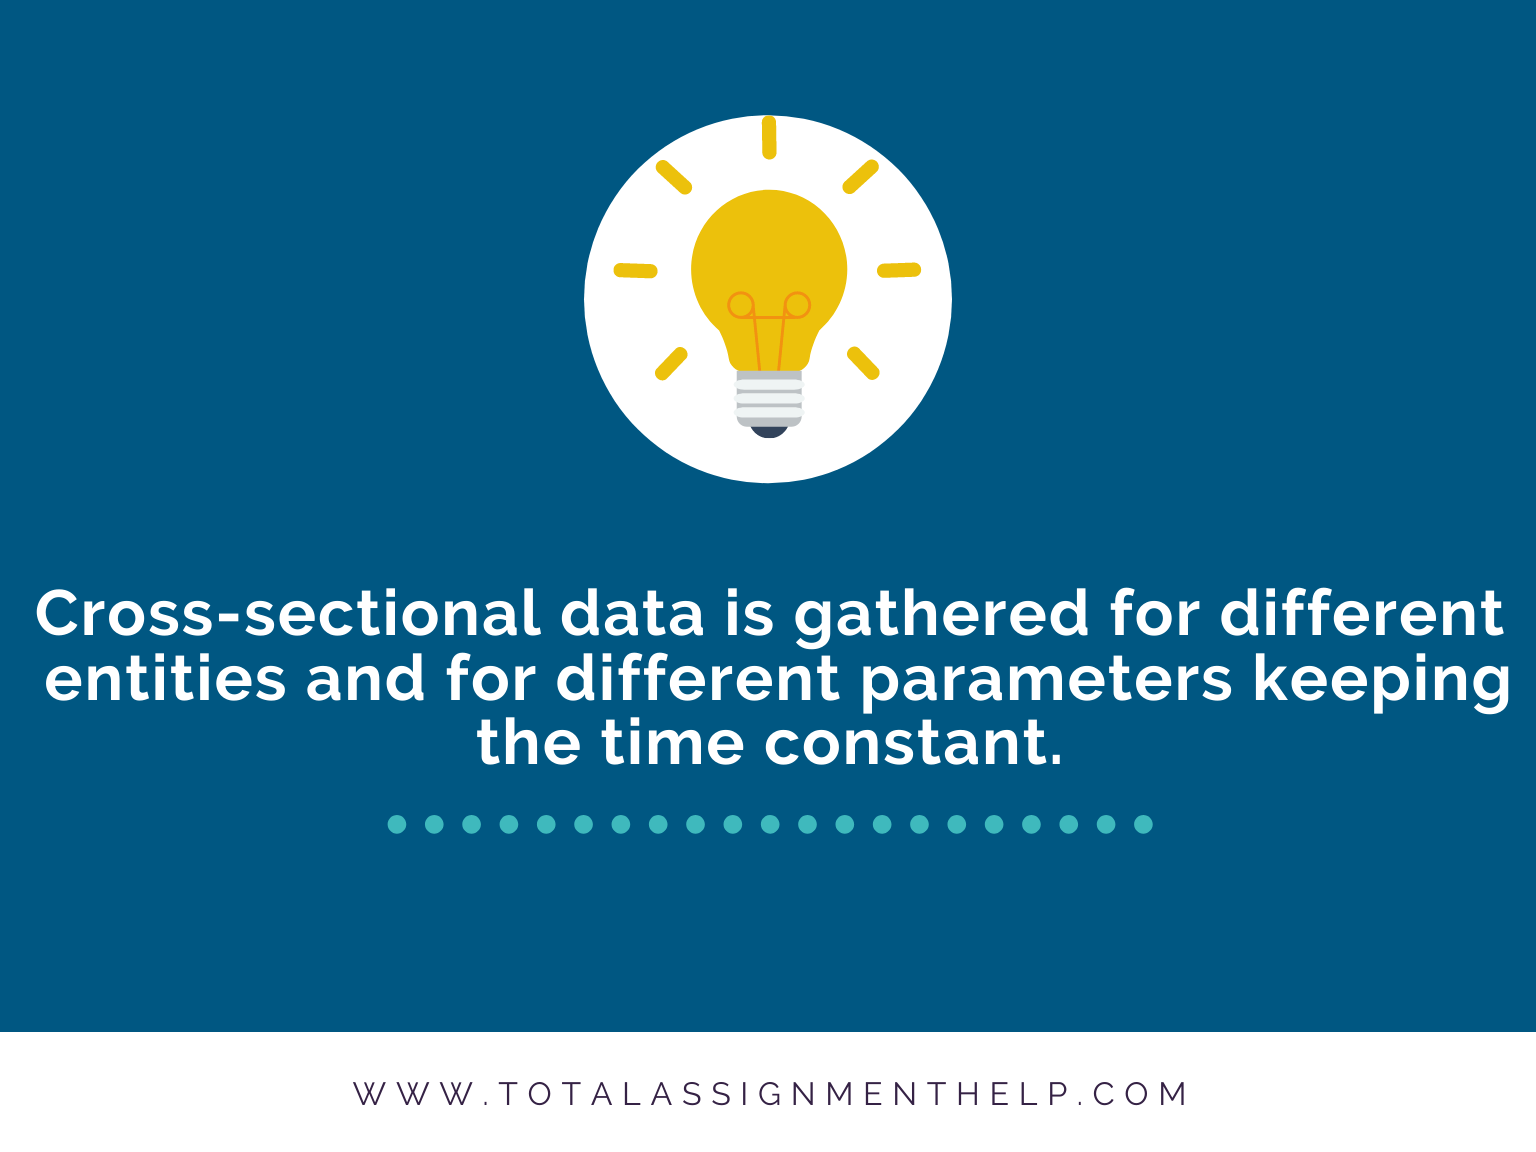
This data is gathered for a number of entities. It involves collection of data points of a large number of entities, but a particular time or a very shortly spaced time period. In this type of data collection, the number of entities and the data points are variable factors, but the time at which each of the data is measured or collected is constant.
Cross Sectional Data is a component of Cross Sectional Analysis or cross sectional study. The data collected for the purpose of performing the analysis is called Cross Sectional data. This data is gathered for a number of entities. It involves collection of data points of a large number of entities, but a particular time or a very shortly spaced time period. In this type of data collection, the number of entities and the data points are variable factors, but the time at which each of the data is measured or collected is constant.
Cross sectional Analysis
Cross sectional analysis is a method of doing research. It basically falls under the quantitative research category. Cross sectional study is usually conducted by individuals in various industries for performing medical research, economic research, social science research, accounting research, nursing research and mathematics research, but this doesn’t limit the scope of cross sectional data. Any number data which is collected for study at a particular time can be categorised as cross sectional data. This data can then be utilised for cross sectional regression analysis of data.
Areas of Use:
Some of areas where cross sectional data is used is in our day to day life.
The data collected for the calculation of census for a state or a country at a particular year is a form of Cross Sectional Area.
The determination of units of each model of car manufactured by BMW for the year 2017 is also form of Cross Sectional Data
The fluctuation is the exchange rate of the Australian currency with respect to the currencies of different countries of the world on today’s date will also be in the form of Cross sectional Data.
Example of Cross Sectional Data
The GDP of different countries of the world for the year 2015:
| Country | Year | GDP(in Trillions) |
| Australia | 2015 | 4.5 |
| India | 2015 | 3.6 |
| Russia | 2015 | 4.0 |
| USA | 2015 | 8.9 |
| China | 2015 | 3.8 |
| Canada | 2015 | 6.5 |
| Pakistan | 2015 | 2.3 |
| Kenya | 2015 | 3.0 |
| Jamaica | 2015 | 2.5 |
The above set of data points is a cross sectional data form as the time is constant and the two factors which are changing are country and GDP.
Time series Data
In this type of data, a particular set of factors or data points are collected over a long period of time or the analysis is performed for the various factors or multi-dimensional data which are varying over equal time intervals such as weekly, monthly, quarterly, yearly.
Time series data is mostly used for quantitative analysis in econometrics and statistical fields. It more intricate as it involves much more calculations and formulas, but it provides a descriptive outcome. Time series data regression is usually done to outline discrepancies or identify trends or abnormalities in the past years. Consequently, it also very commonly used to predict future trends or goals for a company or research with the help of data of previous years.
Pooled Data
It is the third type of data. It is the combination of both cross sectional data and time series data. It is the most difficult to analyse and hence is less than usually preferred. The most useful example of this type of data is the Gross National Product or GNP per capita of Asian Countries for the last decade.
Panel Data
Panel data is also known as longitudinal data or micro panel data. It is a subtype of pooled data. In this type of data, the same factors which are measured in the case of cross sectional data are measured over a long period time. It is mostly used in micro econometrics.
It can be classified into two types:
Balance Panel Data:
Data is said to be balanced panel data, when all quantities are measured at equal number of times and equal intervals.
For Ex:
| Person | Year | Salary | Age |
| A | 2015 | 40,000 | 22 |
| A | 2016 | 55,000 | 23 |
| A | 2017 | 65,000 | 24 |
| B | 2015 | 45,000 | 26 |
| B | 2016 | 54,600 | 27 |
| B | 2017 | 60,800 | 28 |
Unbalanced Panel Data:
When the collection of data is not done in uniform time intervals or if some quantities are measured at more instances than others, it is called Unbalanced Panel Data.
For Ex.
| Person | Year | Salary | Age |
| A | 2014 | 30,000 | 25 |
| A | 2015 | 45,000 | 26 |
| B | 2014 | 40,000 | 26 |
| B | 2015 | 45,000 | 26 |
| B | 2015 | 51,800 | 27 |
| B | 2016 | 55,500 | 28 |
| C | 2015 | 38,500 | 26 |
Comparison
| Cross Sectional Data | Time Series Data | Panel Data |
|---|---|---|
| Same time period | Time Varies uniformly | Non uniform time period |
| Multiple Entities | Single Entity | Non uniform time period |
The above table clearly specifies the basic differences in the three types of econometric data.
Although after looking at the basic differences in them, it can be said that all three types of data have their specific advantages and are utilised in their specific analysis techniques. Hence no data can be termed as more lucrative than the others.
Hope this article helped in identifying the basic differences in cross sectional data, time series data, and pooled data used in econometric analysis.
You can check out the various economic and finance assignment to know more about the practical application of these data types and how the results vary.


